
IWR MONTHLY / OCTOBER 2026
Al Marjan Island location report
A destination thesis needs a delivery and operating-cost thesis.
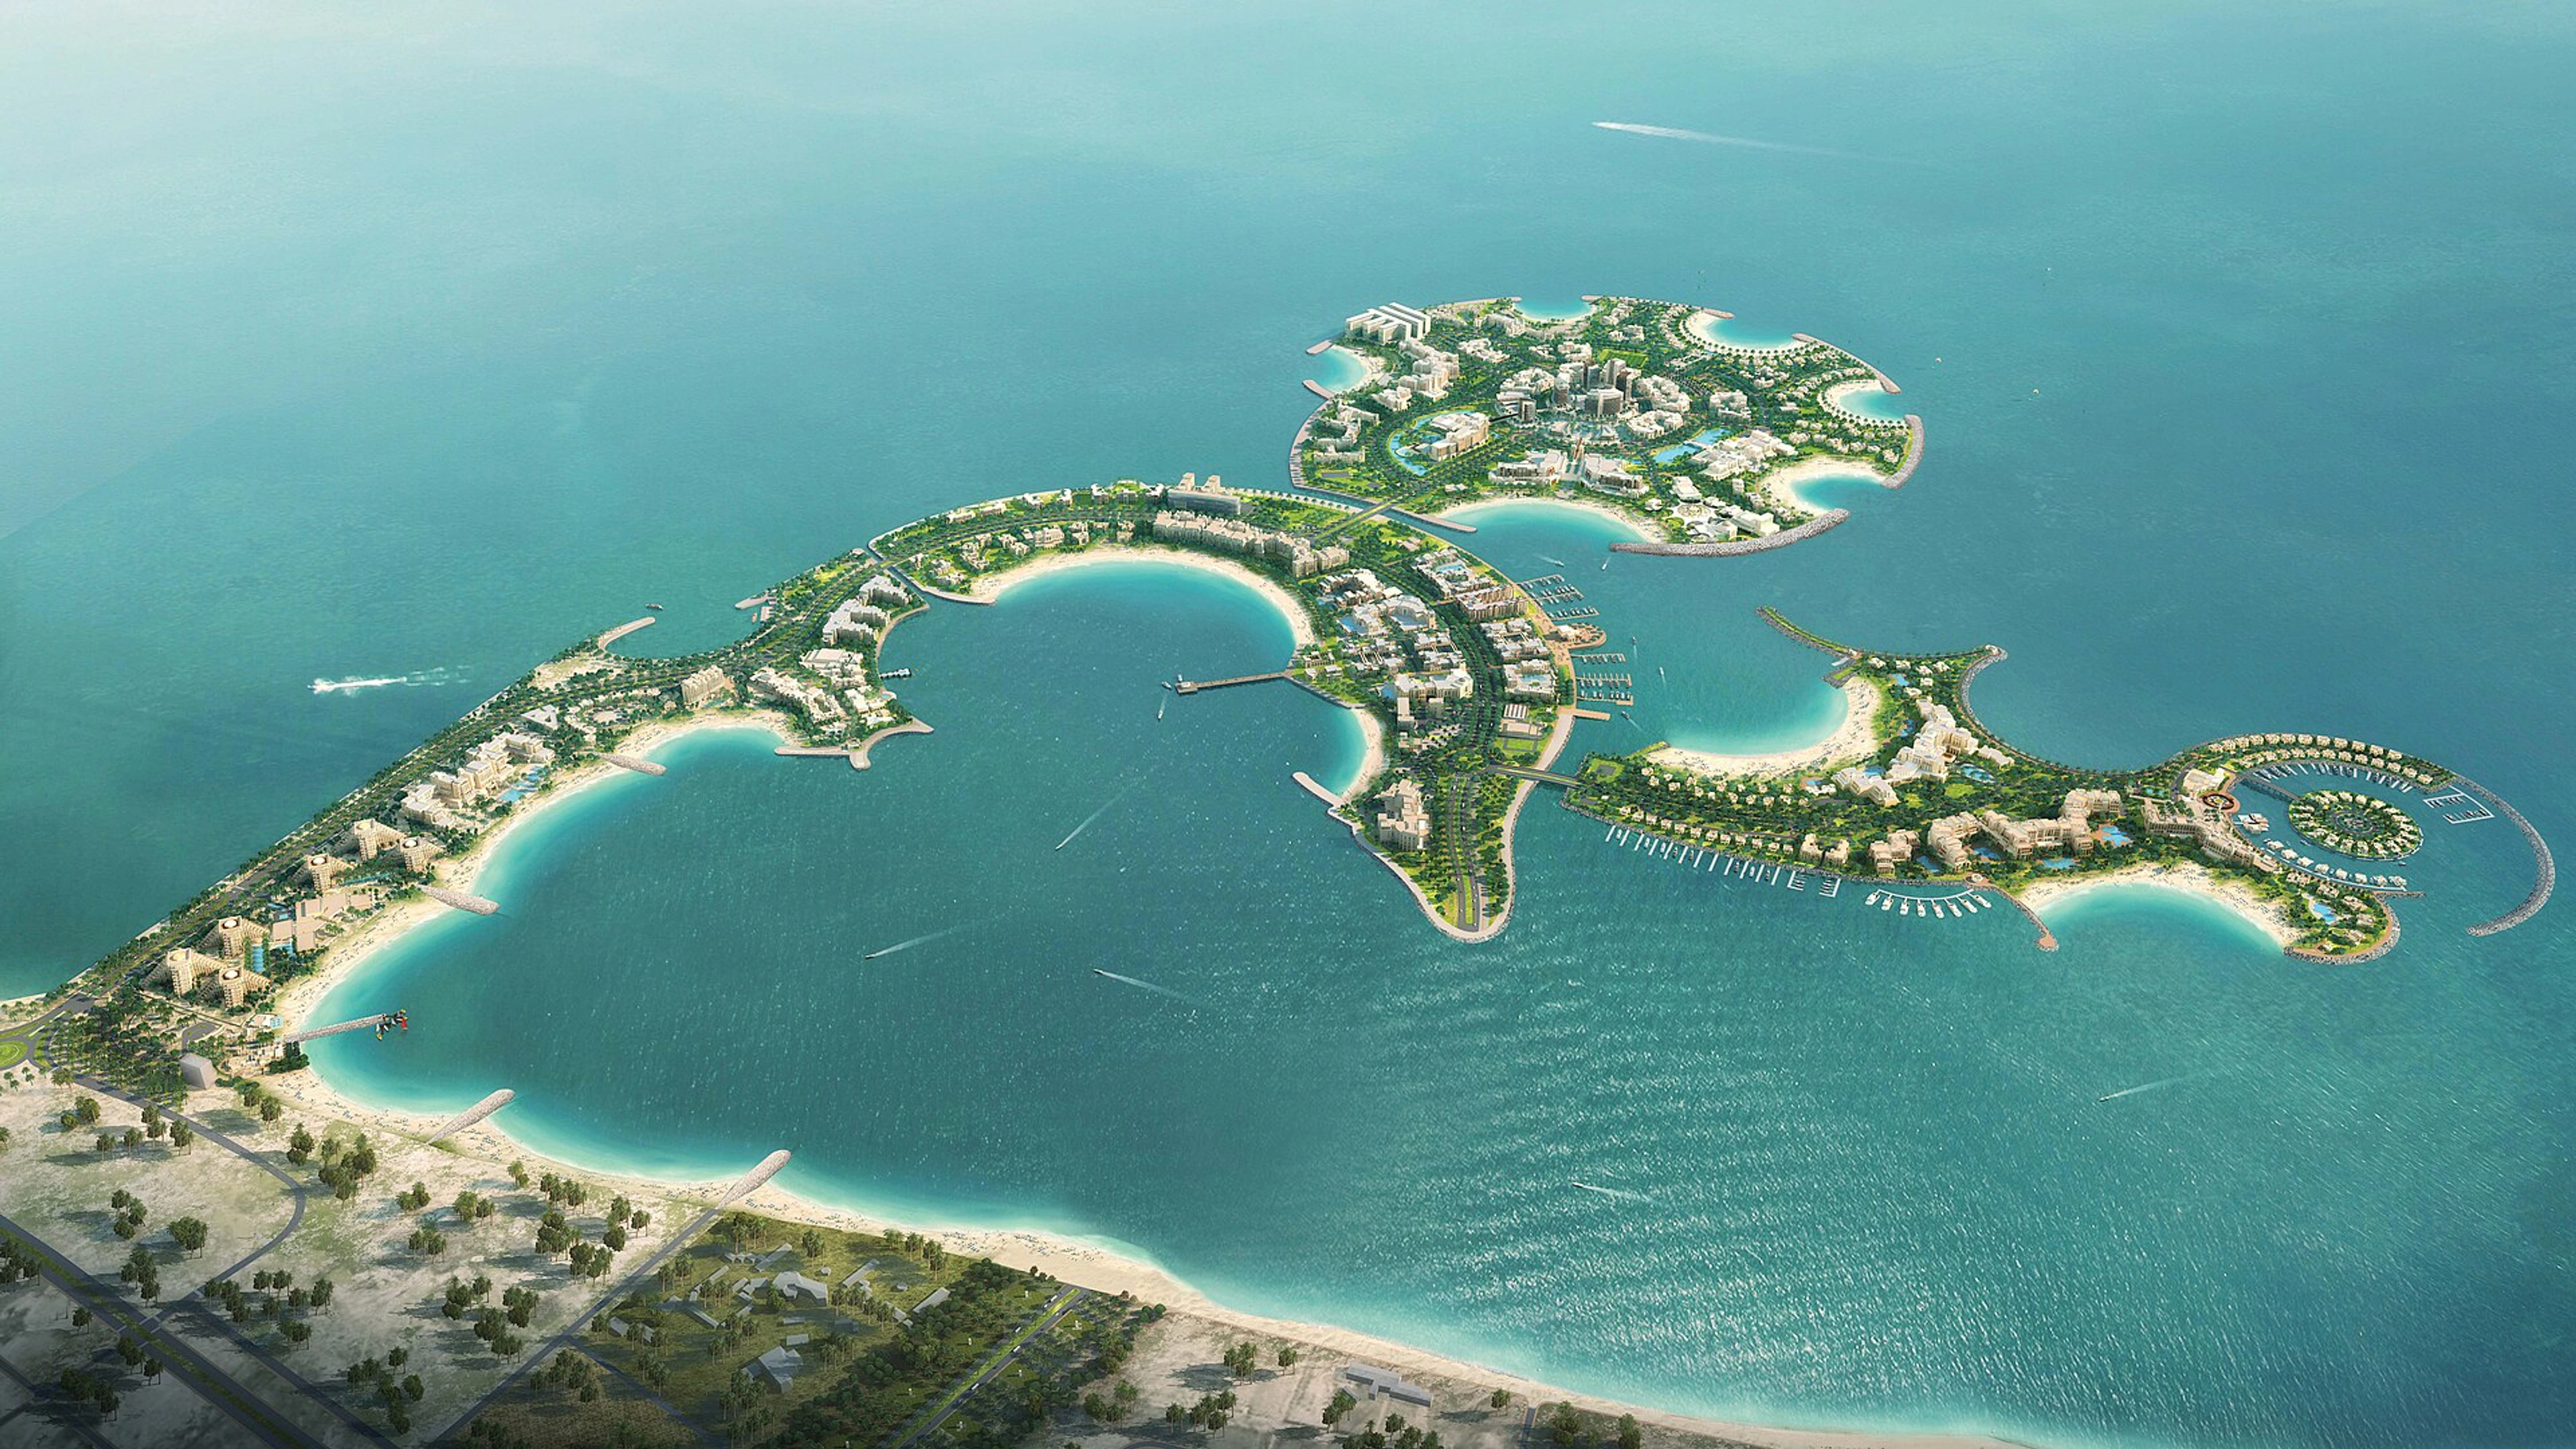
Al Marjan Island · masterplan visualisation · Evidence cut-off 13 October 2026Masterplan snapshot and H1 2026 RAK tourism context
Define the island before pricing the opportunity
Al Marjan Island is not the whole Ras Al Khaimah coastal market.
Marjan describes a four-island waterfront masterplan with 2.7 square kilometres of reclaimed land, 23 kilometres of waterfront and 7.8 kilometres of beaches. Its website lists 18,650 planned residential units and a hotel guestroom pipeline exceeding 8,500. These are masterplan/pipeline figures, not completed supply or units currently for sale.
Keep Al Marjan Island distinct from neighbouring Marjan Beach and RAK Central. A project marketed through the wider destination story must still be located correctly. Beach access, actual views, road connections and competing inventory belong to the individual plot and building.
| Measure | Value (units · masterplan figure, not delivered stock) |
|---|---|
| Planned residential units | 18,650 |
More arrivals can coexist with fewer guest nights
The latest RAK tourism evidence does not support a simple growth-only story.
RAKTDA’s H1 2026 infographic shows approximately 670,000 visitor arrivals against 654,000 in H1 2025, while guest nights declined from 2.27 million to 1.61 million. The report also records a shorter average stay. Arrivals and nights therefore point to different changes in the visitor market.
These observations cover Ras Al Khaimah, not only Al Marjan Island. They cannot be transferred directly to a holiday-home occupancy assumption. For a short-let acquisition, the relevant evidence is achieved rates and occupied nights for comparable properties, alongside the operator’s charges and the building’s rules.
| Measure | Value (million guest nights · emirate-wide context) |
|---|---|
| H1 2025 | 2.27 |
| H1 2026 | 1.61 |
Room rate is only one part of the revenue equation
Higher room prices did not offset the occupancy movement in this period.
RAKTDA reports an average daily room rate of AED 705.6 in H1 2026, against AED 670.7 a year earlier. Occupancy declined from 72.6% to 49.3%, and revenue per available room from AED 487.0 to AED 347.7. These are hotel operating indicators, not residential rents or owner net returns.
The difference explains why an attractive advertised nightly rate is insufficient for an investment model. Occupied nights, seasonality, management, cleaning, platform fees, utilities and service charges affect the amount that reaches an owner. Use the actual product and operating agreement rather than the destination’s hotel headline.
| Measure | Value (% · not apartment occupancy) |
|---|---|
| H1 2025 | 72.6 |
| H1 2026 | 49.3 |
A resort opening is a milestone—not a yield guarantee
Separate destination infrastructure from a residential purchase contract.
Wynn Al Marjan Island is a major resort project within the destination. Its development and operating timetable should be followed through dated issuer statements and official infrastructure announcements. A resort’s opening does not establish that neighbouring homes, access roads or individual buildings will be ready at the same time.
For a residential unit, map its own completion obligations, fit-out or furnishing costs, operating permissions and management agreement. If the purchase depends on future tourism demand, test slower letting and a later income start rather than assuming immediate full occupancy.
Branded, serviced and conventional homes need different comparisons
A shared destination does not make the ownership economics equivalent.
A branded residence may include service commitments, access conditions or an operating structure different from a conventional apartment. The relevant comparison includes what is delivered, which services are included, how charges are set and whether the owner can occupy or let the home as intended.
Compare purchase capital and recurring obligations on the same area basis. Use registered transactions where accessible; keep developer quotations and portal asking prices labelled as offers or listings. No verified island-wide monthly price or rental-yield series is established in this edition.
Watch delivery and operating evidence together
The strongest next evidence is measurable, local and dated.
The next edition should reconcile resort and infrastructure milestones, newly completed residential alternatives and the latest official tourism period. Obtain local achieved-let evidence before converting an island thesis into a unit-level cash-flow forecast.
This October edition combines an official masterplan snapshot with H1 emirate tourism context. It does not label planned homes as available stock or hotel performance as an apartment investment return.
Sources and observation periods
October 2026 edition · published 13 October 2026. The observation period belongs to each metric, not the edition date. Figures are not forecasts or available-unit quotations.
- Marjan official Al Marjan Island masterplan ↗
- RAKTDA H1 2026 market infographic · original official PDF ↗
- Wynn Resorts investor relations · dated project announcements ↗
Research and original analysis: Invest With Raj.
KEEP THE OCTOBER EDITION
Download the
Al Marjan Island report.
The interactive reading is open above. Share your details to receive access to this PDF edition.